
Amazon is the obvious stress test for what I have written about Anthropic and SpaceX. So I ran the same reverse valuation on Amazon three times: at its IPO in 1997, at the dot-com peak in 1999, and today. In the past the business has grown into its prices. What that took is the part people forget.
A note before we start. The 1997 and 1999 figures come from Amazon’s own filings, and I have tried to use only assumptions a reader could have made at the time. Stripping out hindsight is harder than it sounds. I know how the story ends, and so do you.
My last three pieces asked what you would have to believe to buy Anthropic at $2 trillion, SpaceX at $2.3 trillion and Wayve at $8.6 billion. The method was the same each time. Fix the price, then ask what the business must deliver to justify it.
There is a fair reply to all three. My model would have kept you out of Amazon.
Amazon listed in May 1997 as a bookseller that had never made a profit and said it could not forecast its own sales. One share bought that day for $18 is now 240 shares worth about $63,000. If valuation discipline would have talked you out of that, what is the discipline worth?
It is the right challenge, and I would rather run the test myself than wait for someone else to. The answer is not quite the one either side would choose.
May 1997: what the prospectus said
The prospectus is dated 15 May 1997. This is what it told a buyer.
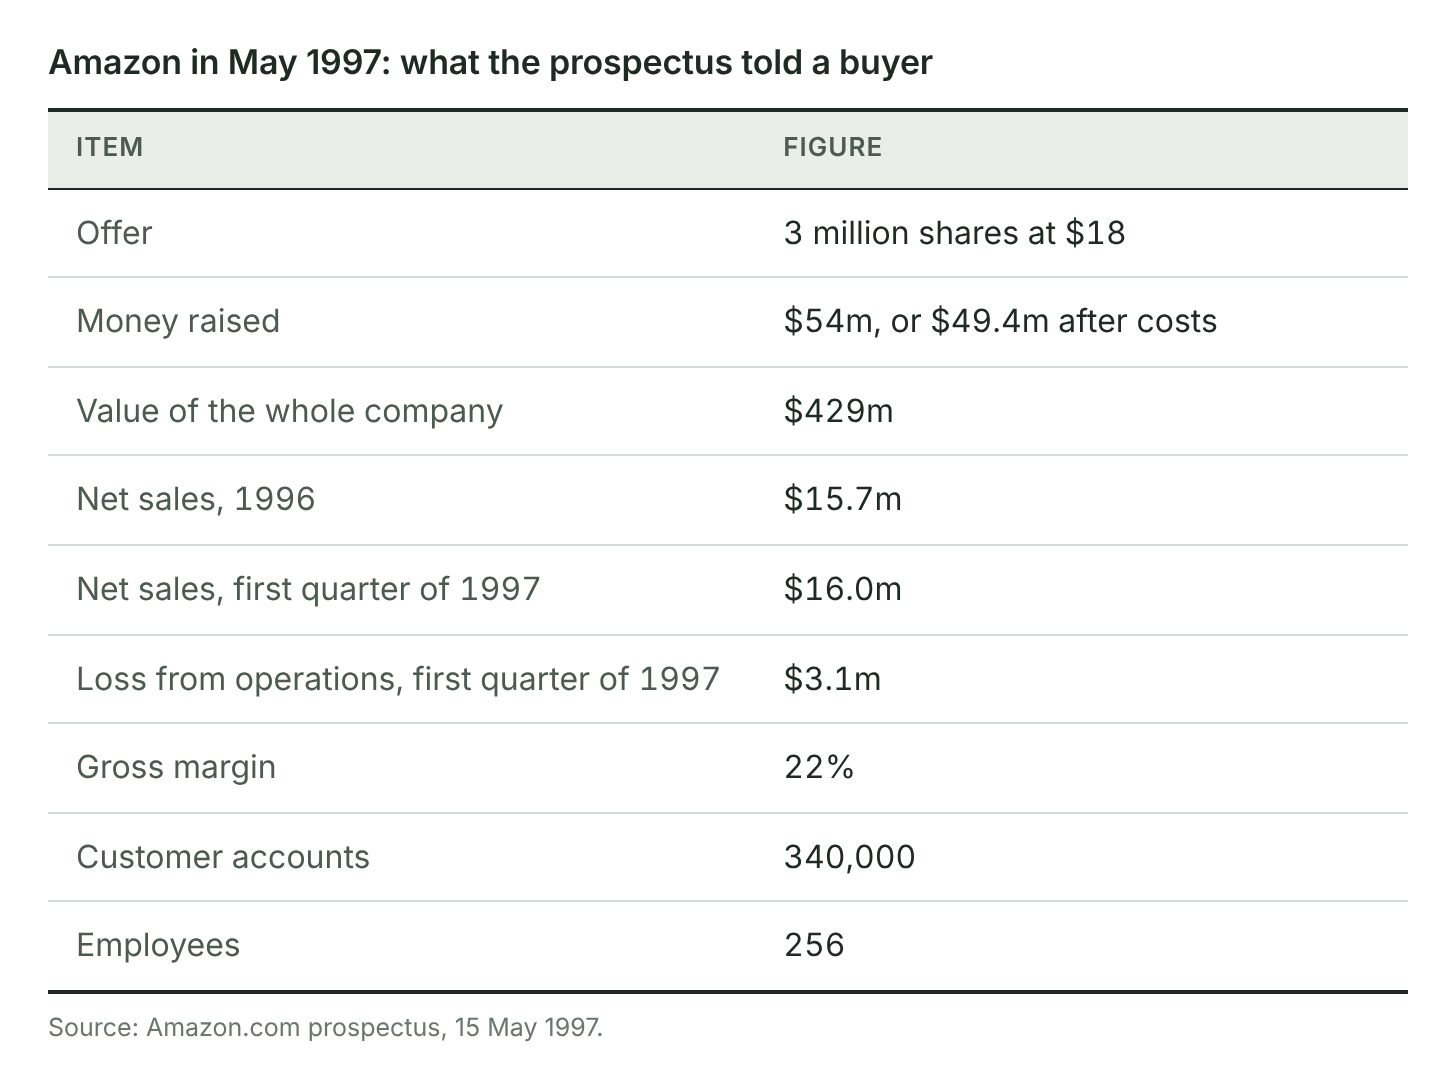
Amazon called itself “Earth’s Biggest Bookstore”. It sold books, and “a smaller number of CDs, videotapes and audiotapes”. It had been trading for less than two years.
The document is candid to the point of bluntness. “Growth rates experienced to date are not sustainable.” The company expected “substantial operating losses for the foreseeable future”. It was “unable to accurately forecast its revenues”. It named Barnes & Noble and Borders as rivals with “significantly greater financial, marketing and other resources”.
One detail stands out to anyone who works with the seven drivers. In the first quarter of 1997 Amazon lost $3.0m, and its operations produced $1.2m of cash. Customers paid by card when they ordered. Suppliers were paid later. The company carried, in its own words, “minimal inventory”. Working capital, the fifth driver, was running backwards: the faster Amazon grew, the more cash its customers lent it.
What $429 million required
The model is the one I have used in all of these essays: Dr Andrew Black’s seven drivers, a value growth duration of ten years, and a residual that assumes no growth after that.
The cost of capital is the ten-year Treasury yield on the day, 6.67%, plus seven points for risk, from the beta and equity premium I used for Anthropic. By coincidence that gives 13.7%, the figure I used there. I assumed a mature operating margin of 7%, which is generous for a bookseller, reached in five years. Tax is nil for five years while losses are used up, then 35%. Each dollar of new revenue needs ten cents of fixed investment, and releases ten cents of working capital.
On those assumptions, $429m required revenue of about $2.9bn by 2007. That is growth of 46% a year for ten years, to 45 times the level of early 1997. It is about 11% of everything Americans spent on books in 1996. About 70% of the value lay after 2007.
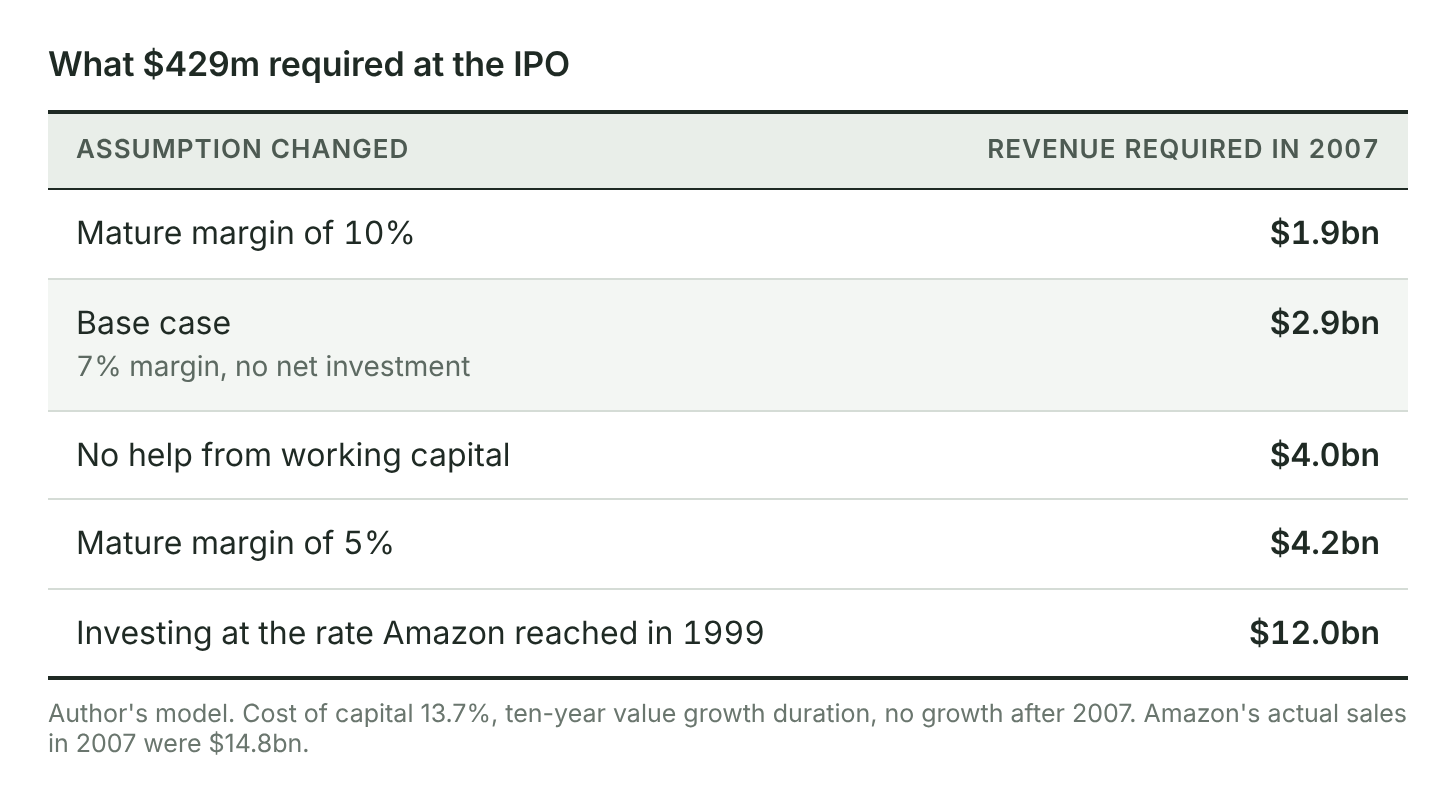
So the IPO price was not cheap. It asked a two-year-old shop to become one of the largest booksellers in the world. Had I run this in 1997, I think I would have called it a stretch, and quoted the prospectus on growth rates.
The table shows what would have mattered most. It was not the margin. It was how much capital the growth would need.
What happened
Amazon’s sales in 2007 were $14.8bn, five times what the price required. It passed $2.9bn in 2001, six years early. Sales had grown by 72% a year.
The operating margin in 2007 was 4.4%, well short of my 7%. But free cash flow was 8.0% of sales, because the working capital kept paying.
There is a stricter test. Give the model no forecast at all. Feed it the free cash flow Amazon actually produced from 1998 to 2007, and value the IPO on that. It still needs one assumption, about what comes after 2007, and I have kept the same one: that year’s profit continues for ever with no growth. The answer is about $1.4bn, against the $429m paid.
So the model, given ten years of the truth and that one assumption, says the IPO was worth more than three times its price. The method did not fail. The difficulty was that nobody could have known the inputs, and the company had said so itself.
December 1999: the price that matters
The IPO is the wrong comparison for Anthropic and SpaceX. The right one came thirty-one months later.
On 10 December 1999 Amazon’s shares closed at $106.69, their high for the boom. That valued the company at $36.8bn, 86 times its value at the IPO. Sales that year were $1.64bn. The loss from operations was $606m. It had borrowed $1.5bn.
I ran the same model on the 1999 accounts. The cost of capital is 13.1%. Investment is 28 cents of fixed capital for each dollar of new revenue, which is what Amazon spent that year, less the same ten cents from working capital.
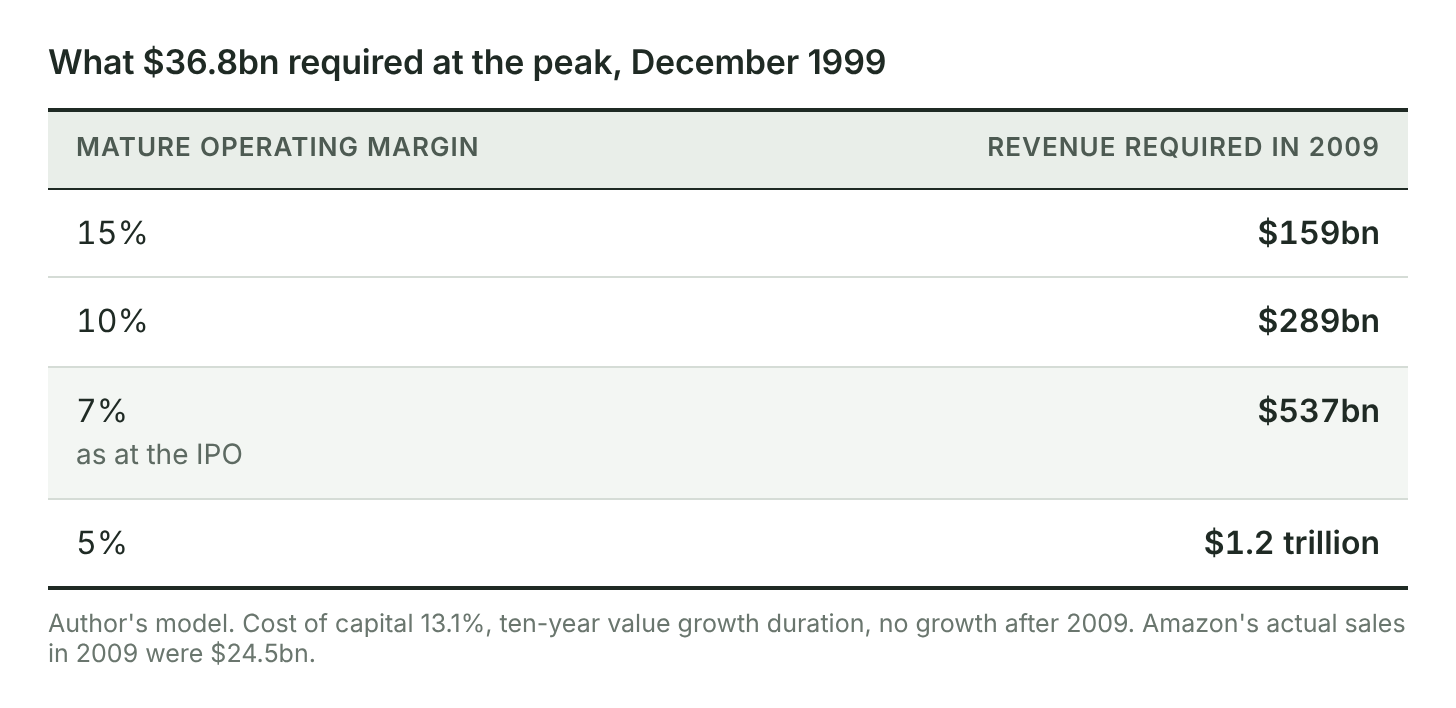
At a 7% margin the price required $537bn of revenue by 2009, growth of 78% a year for a decade. Amazon’s sales in 2009 were $24.5bn, at a margin of 4.6%. The price needed 22 times what happened. Amazon did not sell $537bn in a year until 2023.
The stricter test gives the same verdict. Fed the cash Amazon actually produced from 2000 to 2009, the model values the company at about $3.3bn. That is 9% of the price.
In the Anthropic piece I recalled Andrew Black’s verdict on the dot-com boom: the economics of shareholder value had held, and the market had been engaged in a willing suspension of disbelief. For Amazon in December 1999, the arithmetic agrees with him.
The shares fell 94%, to $5.97 in September 2001. They did not close above the 1999 high again until 23 October 2009, almost ten years later. A buyer at the peak who held to the end of 2009 had earned 2.3% a year.
And yet. A buyer at the peak who is still holding today has made 49 times their money. That is 15.6% a year for nearly 27 years, against a cost of capital of 13.1% on the day they bought.
Even a purchase at the very top of the bubble has paid. It paid for those who sat through a 94% loss and a ten-year wait, and it paid at today’s price, which I come to below.
What did the backfilling?
Three things, and the business in the prospectus is only part of one of them.
Businesses nobody had even contemplated at the time. This is where Amazon’s sales come from now.
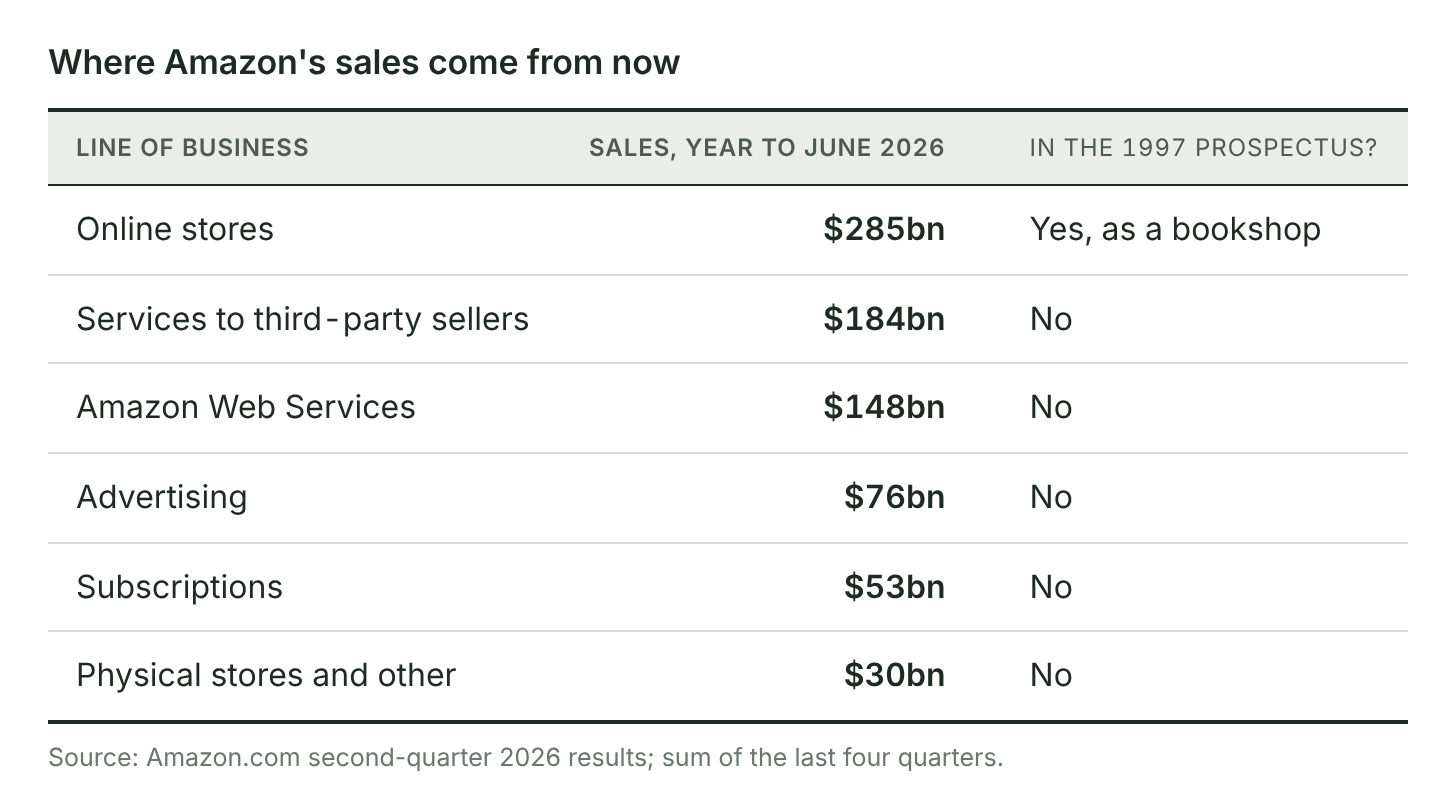
Amazon Web Services is 19% of sales and 58% of operating profit. It was launched in 2006, nine years after the IPO.
With SpaceX I could not explain about $2.1 trillion of the price without businesses that do not yet exist. Amazon is the proof that such businesses can emerge. I have to concede that.
But look at who paid for them. The IPO price needed $2.9bn of sales, and Amazon had that by 2001 from retailing alone. The buyer at the IPO paid nothing extra for the possibility of everything that followed. The buyer in December 1999 paid for it in advance, years before any of it existed.
Other people’s cash. Amazon grew on other people’s money. Customers paid at once and suppliers were paid later, so each sale put cash in Amazon’s hands before the bill for it fell due. In its three worst years, 1999 to 2001, it consumed $813m of cash in total. Today it spends about $460m a day on capital investment. The whole of the cash it burned getting through the crash would not now last two days.
An open window. The IPO raised $49m. The losses that followed were paid for with borrowed money: $1.25bn of convertible notes in February 1999, and more early in 2000, shortly before the market stopped lending to companies like it. Had the crash come a year sooner, I am not sure there would be an Amazon to write about.
Others were not so lucky, and Amazon knew some of them well. It had taken a half share in Pets.com, which listed in 2000 and announced it was closing that November. Borders, which the prospectus named as the better-resourced rival, closed its last shop in 2011.
Today: what $2.8 trillion assumes
The peak buyer’s reward depends on today’s price, so that price needs the same test.
At the close on 9 October, $262.43 per share, Amazon is valued at $2.83 trillion. I have taken off its stake in Anthropic, at the $190bn Amazon carries it at, and a little net debt. That leaves $2.65 trillion for the business itself.
Sales in the twelve months to June were $776bn and operating profit was $94bn, a margin of 12.1%. This is not a company living on promises. At a cost of capital of 11.5%, those profits continued for ever are worth about $630bn. That is about a quarter of the price. The rest is growth.
And growth is no longer cheap. In 1997 each dollar of new revenue needed no net investment. Over the last twelve months Amazon spent $169bn on capital investment and added $106bn of sales. After depreciation, that is 89 cents of investment for each new dollar of revenue. Free cash flow was negative. The company expects to spend $220bn this year, most of it on AI.
At today’s margin, a dollar of new revenue is worth roughly what it costs to win. So growth alone cannot justify the price. The margin has to rise.
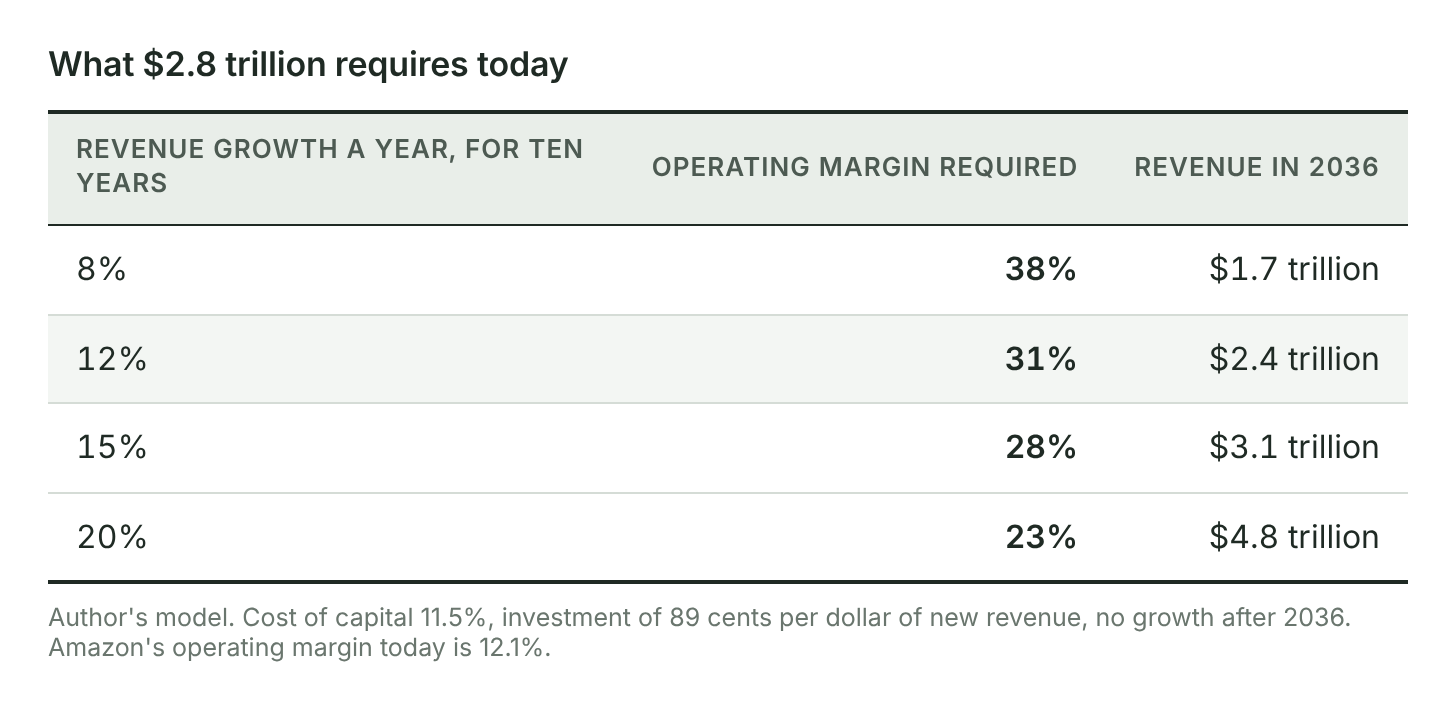
The margin today is 12%. Only Amazon Web Services, at 37%, earns anything like the figures in the table. The price assumes that Amazon as a whole comes to look like its cloud business.
I hold this conclusion more loosely than the others, for two reasons. The model stops all growth after ten years, and Amazon has outrun that assumption before. And 89 cents is what growth cost in a year of exceptional building for AI. To assume it lasts is the kind of straight line I have warned against. At 50 cents, growth of 12% would need a margin of 28%, not 31%. The direction is the same. But it is the question I asked of SpaceX. What does each dollar of growth cost, and what is it worth?
There is one more thing. Amazon owns about a fifth of Anthropic and sells it computing power. Amazon reported net income of $62.6bn last quarter. That included $53.4bn, before tax, of gains on its investments, mainly Anthropic. The precedent I am testing has become part of the thing I was testing it against.
Does Amazon answer the earlier pieces?
In part. I think it leaves four things standing and takes one away.
One conclusion runs under all of it. Whether a business is good and whether it is a good investment are different questions. Amazon was the same company in May 1997 and December 1999. What had changed was the price.
The price you start from. The public was asked for $54m in 1997, for a company valued at $429m. Amazon was not worth $2 trillion until 2024, twenty-seven years after it listed. Anthropic and SpaceX are being offered to the public at about that price on day one. The first buyers of Amazon were paid for the uncertainty they took on. That is the difference between May 1997 and December 1999, and it is the whole of my argument about entry price.
The wait. The buyer at the peak was right in the end and down 94% within two years. Being right eventually is not much use to a pension fund that has to pay out in the meantime, or to a board that has to explain the loss.
The survivors. We are looking at the one that came through. It needed customers’ cash, a funding window that closed behind it, and businesses it had not yet thought of. I would not want to rely on all three arriving again.
Who carried it. In the Anthropic piece I asked who inherits the line. In 1997 nobody had to buy Amazon. A company that lists at $2 trillion soon enters the indices, and the savings of people who never chose it.
What Amazon takes away is some of my confidence in the ten-year horizon. Given ten years of the truth, the model was right about the IPO and right about the peak, over ten years. Over twenty-seven it was too cautious. At a 13% cost of capital, a dollar arriving in year twenty-seven is worth less than four cents today. The arithmetic all but ignores those years. For Amazon they were worth the most.
That sits awkwardly with what I argued in the Straight Line essays, and I should say so. But Amazon’s line was not straight either. Sales growth went from 169% in 1999 to 13% in 2001. Then the business bent again, into something the prospectus never mentioned. Neither bend was visible from 1997. One could have finished the company. The other made it.
What you would need to believe
This series has never offered investment advice. It asks what you would need to believe, and leaves the believing to you. Amazon changes my answer.
I have treated a willing suspension of disbelief as a symptom. Amazon shows that it can sometimes be something else: a belief that will not fit in a spreadsheet and turns out to be right. The longevity was real. Businesses nobody had contemplated created most of the value.
So here is a working hypothesis. What the buyer of such a company needs to believe is not a revenue line. It is that the business contains people who can reinvent it, more than once, for worlds that mere commentators like me can barely imagine.
That would be the underpinning for Anthropic and SpaceX. I could not reach their prices from the businesses we can see. They can only be reached by reinvention. SpaceX can point to one already: Starlink, which grew out of the launch business and now brings in about three-fifths of its revenue. Its AI arm came with the xAI merger at the start of this year, which is buying a new business, not inventing one. Anthropic is younger, and there is less history to judge it by.
It is missing from Wayve’s valuation, and I count that in Wayve’s favour. Mr Kendall talks of robotics and manufacturing, but driving alone could explain $8.6bn. Its investors paid for what they could check. That may say more about Wayve’s stage of life than about its ambition. In this respect Wayve looks more like Amazon in May 1997 than either of the others does.
Amazon also shows where the hypothesis stops. Believing in the people was not enough. Three things had to be true together.
The capacity to reinvent was there, and it has outlasted the founder’s time as chief executive.
The company could pay for its own experiments. Amazon Web Services grew out of what Amazon had learned running its own systems, in a business its customers’ cash had helped to finance. Reinvention at Anthropic or SpaceX costs hundreds of billions before anyone knows what it will be.
The price left the reinvention cheap. At the IPO it came free. At the peak much of it was charged in advance, and the buyer who paid has earned 15.6% a year against a cost of capital of 13.1%.
The third is the one I would hold on to, and it does not resolve neatly. The 1999 price could not be justified by the business anyone could see. It still rewarded an investor patient enough to wait twenty-seven years, by two and a half points a year over the cost of capital. Amazon does not show that suspending disbelief pays. It shows that reinvention is valuable, and that the market can charge for a great deal of it in advance.
Apple, Google, Meta and Nvidia would each test the idea, and not all in the same direction. I have not run their numbers, and I am wary of doing so. They are the winners, and a list of winners proves only that winners won.
This is a hypothesis, not a finding. I cannot tell you how to recognise such people in advance, and in 1999 every company claimed to have them. That is the next question, and I think it belongs to boards as much as to investors.
What a board can take from it
Few boards will ever decide whether to buy Amazon, and buying a share is not the same as running a company. An investor can sell tomorrow. A board has to live with what it commits, though it can also change course. The problem underneath is the same: committing resources to a future that cannot be forecast, while keeping the means to survive and adapt. Most boards are now doing that with AI, on forecasts no better than Amazon’s were in 1997. Four questions follow.
What is our entry price? If the commitment only pays when everything goes right, we are buying in December 1999, not May 1997.
Can we fund the wait? Being right in the end did not spare Amazon’s shareholders a 94% fall. What would the equivalent do to us, and who would we need to stay patient?
Who pays for our growth? In 1997 Amazon’s customers did. Today its shareholders and lenders do, at 89 cents for each new dollar of revenue. Which of those describes our own plans?
Where does our capacity to reinvent sit? If it rests with one person, that is a dependency to be governed. If it rests in the organisation, what are we doing to keep it there?
Amazon shows that a business can grow into a price that nobody could justify at the time. It also shows what that took: a low price to begin with, customers’ cash, an open funding window, people able to invent businesses nobody had thought of, and shareholders who held through a 94% loss.
The first buyers of Amazon were paid for not knowing. I am not sure the next buyers of AI will be.
Notes on the model
Method. Revenue grows at a constant rate for ten years. The model solves for the rate at which its value equals the price. For today it also solves for the margin at a given growth rate. The workbook is Amazon_SHV_reverse_solve_v1.xlsx.
Prices. 1997: $18 on 23.9m shares is $429m; less $57m of cash after the offering leaves $373m for the business. 1999: $106.69 on 345.2m shares is $36.8bn; adding $1.47bn of debt and deducting $0.71bn of cash gives $37.6bn. Today: $262.43 on 10,783m shares is $2.83 trillion; net debt is about $6bn.
Starting points. 1997 uses the first quarter multiplied by four: sales of $64m and a margin of minus 19%. 1999 uses the year: $1.64bn and minus 37%. Today uses the twelve months to June 2026.
Cost of capital. Ten-year Treasury yields of 6.67% (15 May 1997) and 6.08% (10 December 1999), a beta of 1.4 and an equity premium of 5%. Today: 5.25%, as in the earlier pieces, and a beta of 1.25, giving 11.5%. At 10%, the IPO required $1.6bn by 2007 and the peak required $276bn by 2009.
Margin. 7% in 1997 and 1999, reached in equal steps over five years. Amazon’s actual operating margin was 4.4% in 2007 and 4.6% in 2009.
Investment. 1997: ten cents of fixed capital per dollar of new revenue (equipment purchases were about eight cents in 1996), less ten cents from working capital (the 1996 figure was about minus 25 cents). 1999: 28 cents, being $287m of fixed assets bought on $1.03bn of new revenue, less the same ten cents.
Residual. About 71% of the IPO value lay after 2007. At the peak, the required path has negative cash flow in all ten years, so all of the value lay after 2009.
The stricter test. For the IPO: the present value of actual free cash flow for 1998 to 2007 is $525m, the residual on 2007 operating profit after tax is $865m, and cash was $57m, giving $1.45bn. For the peak: $2.4bn and $1.6bn, less $0.76bn of net debt, giving $3.3bn. Calendar years stand in for years one to ten.
A more generous residual. If 2007 free cash flow, not profit, is continued for ever, the IPO is worth $3.0bn, seven times the price. On the same basis the peak is worth $8.2bn, 22% of the price. A peak buyer who sold at the end of 2009, when Amazon was valued at $59.8bn, received just under half of the price in present-value terms.
Losses and cash. Losses from operations in 1999 to 2001 totalled $1.9bn. Cash consumed was $813m. The difference is mostly charges that used no cash, such as the amortisation of goodwill.
Returns. One IPO share is now 240, after splits in 1998, 1999 (twice) and 2022. $18 has become $62,983: 3,499 times, or 32.0% a year for 29.4 years. From the 1999 high the figures are 49 times and 15.6% a year for 26.8 years. Amazon has never paid a dividend.
Today’s investment rate. Capital spending net of proceeds was $169.0bn; depreciation and amortisation was $75.2bn, which includes leases and content; sales rose by $105.6bn. That gives 89 cents net and $1.60 gross. At 50 cents, 12% growth needs a margin of 28%.
Growth at a fixed margin. If the margin rises only to 15%, the price needs growth of 38% a year. At 20% it needs 24% a year, and revenue of $6.7 trillion in 2036.
Anthropic. The stake is deducted at Amazon’s carrying value at 30 June 2026: $92.5bn of preferred stock and $97.9bn of convertible notes. Valuing it at $400bn changes the answers very little.
$2 trillion. Amazon’s market value first passed $2 trillion on 26 June 2024.
Amazon Web Services. Launched in spring 2006, with its storage service first. Amazon’s own account is that it grew out of the company’s experience of running infrastructure at scale. Jeff Bezos stepped down as chief executive on 5 July 2021 and was succeeded by Andy Jassy, who had led the web services business.
SpaceX. In its IPO filing, connectivity (Starlink) was 61% of 2025 revenue, space 22% and AI 17%. The AI segment joined through the merger with xAI at the start of 2026.
The other four. Steve Jobs left Apple in 1985 and returned in 1997. Google Search and related advertising was 55% of Alphabet’s revenue in the last quarter of 2025. Facebook listed at $38 on 18 May 2012, fell to $17.55 that September, and did not see $38 again until August 2013, by which time mobile was 41% of its advertising revenue. Nvidia listed in January 1999 as a maker of graphics chips and introduced CUDA, which opened those chips to general computing, in 2006.
Sources
Amazon.com IPO prospectus, 15 May 1997
Amazon.com quarterly report, third quarter of 2000, for shares in issue at the end of 1999
Amazon.com results for 2001, for cash flows in 2000 and 2001
Amazon.com annual report on Form 10-K for 2002, for sales and operating results 1998 to 2002
Amazon.com annual report on Form 10-K for 2009, for 2005 to 2009
Amazon.com second-quarter results, 30 July 2026 and quarterly report
Federal Reserve H.15 releases of 19 May 1997 and 13 December 1999
Amazon Hits New High, Crossing Wall Street, 30 November 2009, for the 1999 closing high and the date it was passed
Amazon stock price history and cycles, BloFin Academy, for the 2001 low
Stocks Rebound in 2009, Publishers Weekly, 11 January 2010
Amazon share price history, StockAnalysis, for the close of 9 October 2026
If you bought 1 share of Amazon at its IPO, Nasdaq, for the share splits
Amazon market value by year, TickerLeague
A $10,000 investment in Amazon and the Anthropic stake, Motley Fool, 15 September 2026
The failure of Pets.com, Tedium, 12 January 2017
Borders files for bankruptcy and closes its last bookstores, History of Information
The earlier pieces: Anthropic: What does $2 trillion assume?, SpaceX: what does $2.3 trillion assume? and Wayve: what does $8.6 billion assume?
The Straight Line Fallacy: When Innovation Causes the Default, Monolithic Intelligence versus Governed Intelligence, The Division of Intelligence
Our origins, Amazon Web Services
Amazon hits a stock market valuation of $2 trillion for the first time, Associated Press, 26 June 2024
Jeff Bezos steps down as CEO of Amazon, KOAA, July 2021
Inside SpaceX’s IPO filing, Hargreaves Lansdown
Steve Jobs returns in 1997 to revive a moribund Apple, eWeek
Facebook passes $38 initial public offering price, MPR News, 1 August 2013
If you had invested $500 in Nvidia’s IPO 25 years ago, Motley Fool, 28 October 2024
Richard Anderson
Founder, AndersonRisk
This essay was first published on 13 October 2026 on my Substack.